OEE Evaluation with Python
In this course, work data from a manual working station will be analyzed according to different KPI, such as the Overall Equipment Effectiveness (OEE).
Table of Contents
Learning Outcome
In this course, you will learn how to use existing sensor data to calculate work indicators, such as the OEE. You will also create visualizations for further data analysis and interpretation.
1.1 Requirements
- Basic programming principles
- Basic knowledge of Python including Pandas
Hint: If you're unfamiliar with Python or need a refresher, please prepare the following micro courses:
Hint: If you have not worked with Pandas before, please prepare the following micro course:
Hint: You can download a Pandas cheat sheet here:
1.2 What You Need
1.2.1 Hardware
- Laptop or PC
1.2.2 Software
- PyCharm Community version
- Python 3.8 (or larger)
1.3 Sources and Resources
2. Task
The Industry 4.0 model factory at FH Aachen includes a manual working station (MWS). The MWS includes different sensoric devices for user and workspace tracking as well as a projector to display work instructions. Currently, the MWS is used for a variety of assembly tasks, such as the mounting of an industrial handgrip or a dog-shaped structure.
The data from the MWS will be used for the indicator calculations. In order to see and understand the work data, you need to set up the work environment first.
3. Setting Up the Work Environment
All required data and the prepared Python modules are available in a GitLab repository: OEE Python Course Repository
Todo
- Fork and clone this repository (using HTTPS).
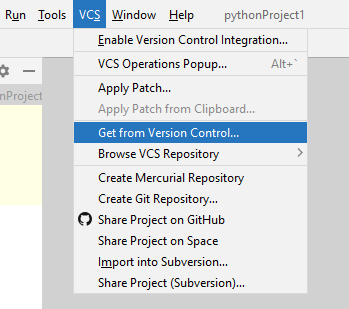
-
Check if all required libraries (see
requirements.txt) have been installed automatically. Therefore, go to Files -> Settings -> Project -> Python Interpreter. If libraries are missing, you can manually install them using the + symbol. -
Add a new Python run configuration to start the program logic in PyCharm. Add your module (here:
analysis.py) to the configuration. Set the working directory to your project folder.
-
Check if the main function is executed when you start the configuration (the logger should show an
AssertionError: The functionget_dataframe_from_directoryhas no return value). (The assertion error is thrown as the functionget_dataframe_from_directoryis not yet implemented.) -
Include style checking using flake8 to make your program more readable. Add the module which should be checked in Parameters. Set the working directory to your project folder.
- You can automatically check your programming style before executing the main program logic by adding the flake8-configuration to your main configuration.
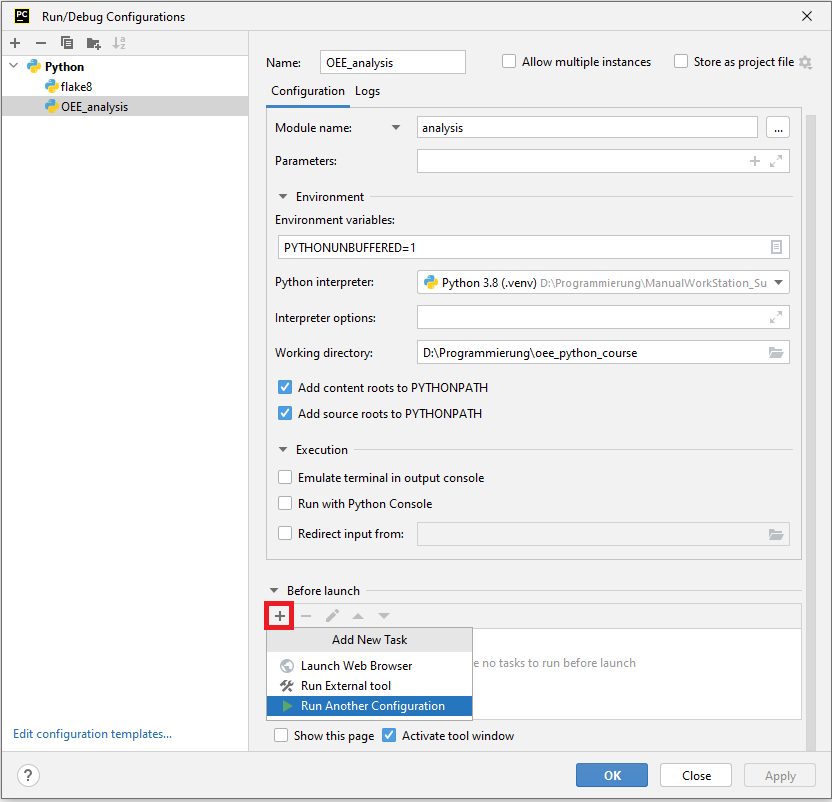
- Check if the work data is in your project repository.
4. Understanding the Work Data
The MWS of the Industry 4.0 model factory displays situation-dependent work instructions and detects user interactions. It consists of:
- A height-adjustable working desk on which instructions can be projected.
- A storage area with a pick-by-light system.
- A tool holder and two acknowledgment buttons.
- A Poka-Yoke workpiece holder for assembly operations.
The work sequence consists of 20 work steps in which parts must be mounted or clipped to form an industrial handgrip of the company Item Industrietechnik GmbH. One tool, a screwdriver, is required for the assembly execution. First, the side parts of the handgrip are pre-mounted twice and placed in a storage box. Afterward, these side parts are attached to the main profile, and the covers are placed over the screws.
In order to reduce the assembly complexity and simplify the small parts handling, a workpiece holder is used. The workpiece holder consists of 3D-printed parts, which limit the mounting options. This way, unintended errors are prevented (Poka-Yoke principle).
The manual workstation is capable of detecting the majority of user interactions automatically:
- A LiDAR sensor is used to capture grabbing actions in the storage area.
- The tool holder identifies if a tool is available or not.
- The workpiece holder checks if the workpieces are placed in the correct positions.
- Also, two check positions are integrated, ensuring all covers are placed correctly, and the side areas are mounted tightly.
As the cover clipping cannot be identified automatically, these work steps must be acknowledged manually by pressing a hand or foot button. In order to evaluate the user interactions, the system stores all interactions on a granular basis, including user ID, timestamps, durations, run number, and correctness.
For a user study, over 60 test persons were asked to assemble the handgrip five times at the MWS. The participants had different backgrounds, from mechatronics to psychology.
Todo
- Check the provided work data in your project repository (folder
workdata).
Each number (501-5xx and 601-6xx) represents a test user who was requested to manufacture the handgrip five times.
The node specifies the name of a work step according to a given work sequence. For instance, the work sequence starts with a work step (node) called “Place_Nut_1” followed by “Place_Holder_1”. Each work step can include several user interactions, such as picking a nut and placing it afterward.
The “DefaultTime” specifies an initial approximation of working times according to the performance of ten initial users.
In this project, the goal is to analyze the obtained work data according to productivity and quality; the main focus is on the Overall Equipment Effectiveness (OEE). In this application example, the different working days should be analyzed and compared.
As the work data was obtained during a user study, no traditional working shifts were used but time slots (60min) during which the participants had to assemble the handgrip five times but also answer some questionnaires. The starting time of the planned working slots were noted in a .csv file.
- Check out the planned work slots
planned_working_times.csv.
5. Basic Program Structure
For this course, a basic program structure is provided which predefines all required functions to solve the data analysis task. The main() function includes predefined function calls related to the different sections of this course. It also includes tests to automatically validate the function implementations.
Todo
- Open the
analysis.pyfile and check themain()function. It contains the outline of this course and is structured accordingly. It looks complicated, however most of it are associated tests. Look for instance atassert df is not None. This line raises anAssertionErrorif the variabledfisNone. The testing provides you with direct feedback and lets you know if your implemented functions work as expected.
Please only change the main() function when instructed during this course (indicated by the term FIXME). All new program code should be added to the other predefined functions.
The predefined functions contain documentation explaining how the function should work. Additionally, hints are provided to help you implement the functions. For every hint, usually just a few lines of code need to be written. You should use the hints to comment your code. Feel free to find your own solution if you don’t want to follow the hints.
6 Data Preparation - Work Data
In the first step, the obtained work data files should be merged into one dataframe. Therefore, the function get_dataframe_from_directory should be implemented.
Todo
-
Expand the
get_dataframe_from_directoryfunction to load all work data files and put them in one dataframe. -
Ensure that the timestamp is in the Pandas datetime format and use the timestamp as index and sort your data according to it using
sort_index(). -
Remove all columns containing “Unnamed”.
-
Check if the created dataframe gets validated successfully and if the dataframe has the correct shape.
In the second step, sensor-based picking errors should be removed from the user data analysis.
Todo
-
Implement the
mask_dataframefunction to remove:- All rows that contain “RemoveItem” in the column “ActionName”.
- All columns that contain “pickItem” in row “ActionType” only if row “Error” is
True.
-
Check if the adjusted dataframe gets validated successfully and if the dataframe has the correct shape.
6.1 Base Value Calculation
Based on the obtained work data, the following information should be calculated for further analysis:
- Cycle times per user and run.
- Mean times per user action (e.g., mean times for action “pickItem” for object “Nut”) as setpoints for production planning.
Cycle Times
The cycle times (run times) allow an analysis regarding the individual user performance. Also, it can be analyzed if the user performance increases with the run numbers.
Todo
-
Implement the
calculate_cycle_timesfunction. -
Create a new dataframe which includes all single cycle times per user and run number.
-
As the timestamps still include the removed actions, please use the
DeltaTimevalues for your cycle time calculation. -
To create a better overview for the data analysis, calculate the following information and put them in the predefined dictionary:
- Minimum cycle time (seconds) for all runs of all users.
- Average cycle time (seconds) for all runs of all users.
- Maximum cycle time (seconds) for the last run of each user.
- Average cycle time (seconds) for the last run of each user.
-
As the timestamps still include the removed actions, please use the
DeltaTimevalues for your cycle time calculation.
Setpoints
The obtained data should be used to set new default times (setpoints) for future handgrip assembly actions at the MWS. For instance, the default times are required to provide individual feedback to each user regarding his performance and improvements. As the mounting actions vary in effort and dexterity, individual default times for each action are required instead of general default times per action type.
Todo
- Implement the
calculate_setpointsfunction to calculate the average working time per user activity and store them in a CSV file for further usage. The average working times should be specified according to “ActionType” and “Node”. Also, return the setpoints as a multi-index pandas series.
7 OEE Calculation
The overall equipment effectiveness is one of the main process indicators for production environments. It is calculated for production resources (e.g., a manual work station) for specific time intervals (e.g., days). It is not used to compare the effectiveness of different production resources but to analyze the effectiveness of one specific resource.
The typical OEE calculation is based on the three OEE Factors: Availability (A), Performance (P), and Quality (Q).

In general, there exist different possibilities on how to calculate the OEE parameters.
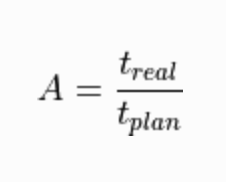
For the availability (A), the real production time is compared to the planned production time. For instance, a workstation was planned to be operated 6 hours during an 8 hour shift; however, it was only running for 3 hours due to unplanned circumstances. Thus, the availability of this time interval is 50%.
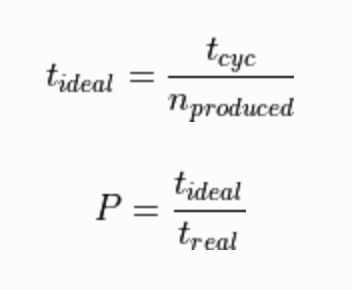
For the performance, the ideal production time is calculated using the planned cycle time and the number of produced parts. Next, the ideal production time is compared to the real production time for the produced parts. For instance, 100 parts were produced during the three hours (180 minutes) working time. According to the production planning, each part requires a planned cycle time of 1 minute. Thus, ideal production time was 100 minutes and the performance of this time interval 55.5%.
The quality is usually calculated by dividing the number of good parts by the total number of manufactured parts. For instance, 90 parts were good parts and 10 parts got rejected. Thus, the quality was 90%.
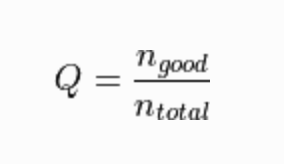
In this example of a handgrip assembly, the quality of the assembly routine is calculated instead of focusing on finished assembly parts. Therefore, the number of correct production actions are compared to the total number of production actions.
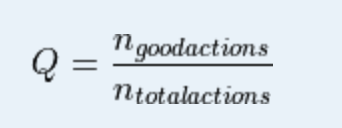
In order to calculate the OEE indicators, the existing dataframe will be expanded.
7.1 Work Information per Day
The availability calculation for the obtained dataset is a bit tricky as the work data was obtained in a user study with a fixed number of runs and not in a traditional shift system. Therefore, the planned production time per day is accessed. The planned starting times of each user slot can be found in the file planned_working_times.csv.
Todo
- Adjust the function
calculate_work_data()to create a new dataframedatawith work information according to working days.
For the OEE indicator calculation and analysis, the following information is required per working day:
- Number of timeslots (
TimeSlots). - Number of users (
Users). - Number of user work actions (
Actions). - Number of production steps with errors (
Errors). - Number of produced parts (
ProducedParts). - Real working time (
RealWorkingTime). - Unused working time due to no-show participants (
UnusedWorkingTimes).
7.2 OEE Parameters per Day
As all required information has been obtained in the previous steps, the OEE parameters can be calculated per working day.
Todo
- Adjust the
calculate_oee()function to add the OEE parameters per day to the existing dataframedata.
8. Visualisation
Visualizations help us to understand and interpret data. Typically, matplotlib is used for this purpose. However, the pandas library also provides basic functionalities to create plots which can be further adjusted using matplotlib.
If you want to create a new visualization or if you are looking for some specific elements, such as titles or colorbars, it is always a good option to use examples: https://matplotlib.org/stable/gallery/index
8.1 OEE Graph
Todo:
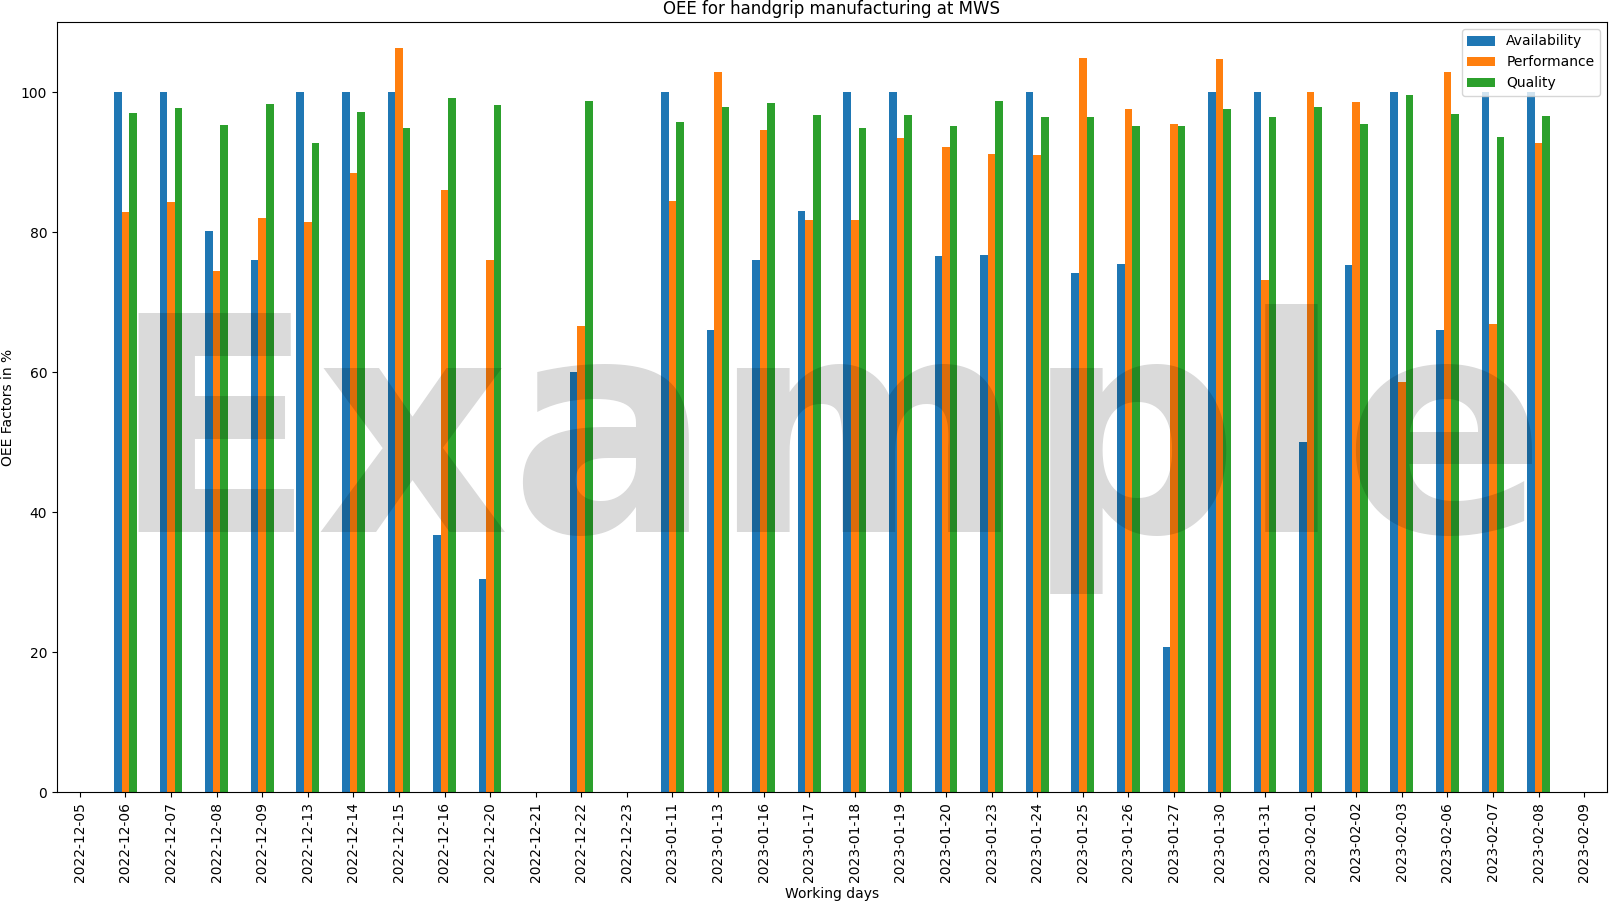
Implement the function draw_oee() to create an OEE bar chart displaying the OEE parameters per day. Include a heading, axis labels, and a legend. Show the parameters in % and adjust the figure size according to your data.
Save the figure as png-file in the folder figures.
8.2. Scatter plot - cycle times
Todo:
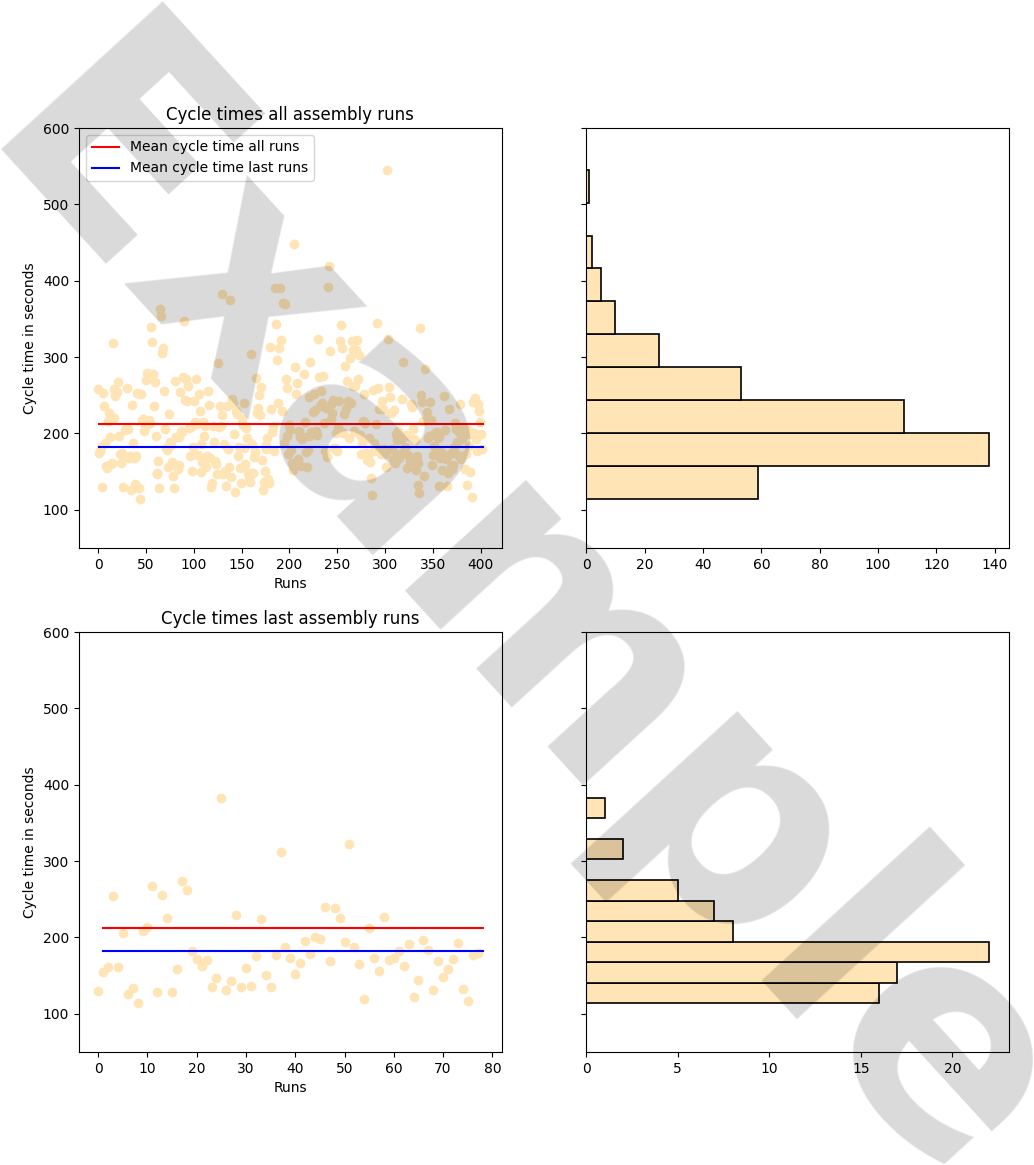
Implement the function draw_scatter to create one scatter plot for all cycle times (each point should represent one run) and one scatter plot for the cycle times of the last run. Add a histogram to both scatter plots.
Also, add a line plot for the average cycle times to both scatter plots.
Save the figure as png-file.
Do not forget to label your axes and include a heading.
Data Evolution
Now you have a good basis to understand your data and start improvement processes.
Todo:
- What would you do to improve the OEE?
- What do you see as main factors which negatively influence the OEE?
10 Troubleshooting
10.1 The render backend does not work
Usually, the render backend from matplotlib should open an interactive window. If this is not the case, there is some error with the installation. As a quick fix you can avoid the interactive window, by using the plt.savefig to store the graph on your filesystem. If you want to draw a new graph, you need to remove the old graph from your memory. Usually, this is done automatically, by closing the interactive window. Call plt.close to to this task manually.
